Impact Journey
Where to focus first? Mapping to understand the perspective of the impacted
When working on problems embedded in complex systems, it can be hard to know where to focus first. Understanding the problem from the perspective and experience of impacted individuals is helpful for homing in on pain points and critical for designing effective solutions.
To meet this need, we’ve created a visual tool, the Impact Journey, to reflect the experience of impacted people by breaking down a complex impact area into a detailed step-by-step journey that surfaces obstacles, pain points, desires, interventions, successes, gaps, and opportunities.
We consider the Impact Journey to be one of our most important tools — invaluable for finding and narrowing in on leverage points, bottlenecks, and unmet needs.
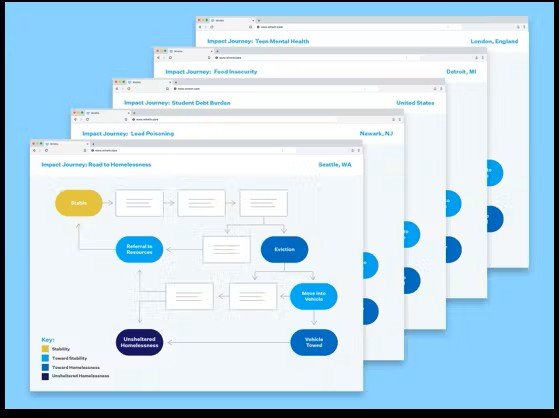
Impact Journeys are detailed visual maps that illustrate the journey through an impact area from the point of view of the impacted person(s), representing all possible steps, interactions, and pathways as identified through research, interviews, and community insights.

Abridged overview of the Food Insecure Shopper Impact Journey
While the abridged version of an Impact Journey introduces the overall concept and a path with highlighted steps and bottlenecks, the full completed Impact Journey map illustrates the full journey as they navigate through the impact area, highlighting the gaps in services or bottlenecks that inform us of potential leverage points to magnify the impact an innovation solution could have.

Screenshot of complete Food Insecure Shopper Impact Journey [link to complete Impact Journey]
How it works
Impact Journeys can be created in any diagramming tool or even a whiteboard. A simple and consistent visual mapping language is used so they can be more easily understood, shared, and linked. Impact Journeys can convey different altitudes, showing high-level overviews or intricate steps.
Steps are displayed sequentially and layered with contextual information such as engaged organizations, resources, key statistics, policies, etc.
Each step mapped in the Impact Journey follows the perspective of the people who are impacted by these steps. The specificity of the “impacted” determines the specificity of the entire Impact Journey.
Some examples of impacted persons include:
low-income families
college students
public transit riders in King County
voters with disabilities
Some examples of impact areas include:
rising food insecurity
emergency rental assistance
equitable access to education
pathway to homelessness
Because Impact Journeys map the experiences of impacted people and their interactions across all sectors, organizations, and domains of knowledge, they reflect a holistic and empathetic view that cuts across an impact area — this makes them an effective tool for synthesis, analysis, focusing, and for sharing a rich picture of the impact area.
Impact Journeys also highlight potential focal points for collaborative effort and reveal where different orgs and services show up and where there are gaps.
Insights from collaborative mapping
Tremendous value can be gained from bringing together people with a diverse experiences and knowledge and from a range of sectors to collaboratively map an impact area. Insights, ideas, and connections emerge as participants see a new perspective of their experience or organization in the context of the Impact Journey.
Linking Impact Journeys to build a richer picture
Individually, Impact Journeys are powerful analysis and sharing tools — their value and benefit can be significantly increased when they are shared and linked. Linking Impact Journeys creates opportunities for an expanding picture of the impact area, a region, a population, and more.
Some examples of the rich potential of linking:
Identifying bottlenecks or unmet needs that exist across multiple Impact Journeys to surface new leverage points for impact
Comparing Impact Journeys that map different populations in the same impact area and geography can provide insight into where the two different populations pathways converge or diverge and what resources could be applied differently
Linking Impact Journeys created at different times for the same geography and population would make it possible to visually see changes in the impact area over time
Linking relevant Impact Journeys created at different altitudes would make it possible to dive from the 10,000-foot view down into a detailed map and then back up again
Thank you to University of Washington Evans School, Foster School, and iSchool graduate students for their contributions to Impact Journey design and usability


-
Current:
Individual Impact Journeys with valuable data, knowledge and insights (such as bottelnecks, painpoints, pathways, etc.) locked in visual diagram
Impact Journeys are not usefully searchable
Impact Journeys are not usefully linked.
Future:
Structured Impact Journey data that allow insights and knowledge in Impact Journeys to be open, shareable and repurposable. Ability to export or scrape Spotlight data.
Impact Journey data stored, searchable and explorable. For example, one could search for all Impact Journeys with a given bottleneck or impact population.
Impact Journeys linked manually and through AI that identifies connections. See Linking Impact Journeys for examples.
-
Data - description and/or potential source.
Title - title or subject of Impact Journey.
Geography Represented - geographical area represented in the Impact Journey.
Impact Area(s), Impact Tags - SDG’s, SPI’s, etc. pulled from the Impact Journey.
Impacted People - description of impacted population whose experience is represented in the Impact Journey (e.g., adults ages 65+ experiencing food insecurity) pulled from the Impact Journey.
Keywords - related terms useful in creating linkages human and AI suggestions.
Research Description - description of research upon which Impact Journey is based on (e.g., Based on 40 interviews conducted with people with experience and knowledge from all sectors and facets of the food system and addressing hunger, including 10 seniors experiencing food insecurity in Denver metro-area) provided my Impact Journey creator.
Research Timeframe - date range in which research is conducted.
Steps/Nodes and Corrections - ML analysis of Impact Journey.
Identified Bottlenecks and Opportunities and Any Information Recorded About Then in the Map - human entered and ML.
Orgs and info about all steps and maps in which they appear (including links) - ML analysis
Resources and all steps and maps in which they appear - ML analysis
Connected Impact Journeys - human entered and ML.
Links to any other supporting or related materials - human entered and AI.
Contributor(s) - names of creators and contributors.
TLDR
Impact Journey is a detailed, step-by-step visualization of an person’s journey in an impact area based on research and interviews
Provides a network view of a system with contextual information layered on top
Reveals where different orgs and services show up to the impacted person and where there are gaps to address
Deepens understanding of impact
Needs Addressed by Impact Journey
Breaks down a complex system into steps experienced by the impacted person, surfacing first the bottlenecks or opportunities that become potential leverage points
Highlights potential onramps or focal points to maximize the scale of the innovation solution